
Technical Analysis For Beginners
The Ultimate Technical Analysis Guide For Beginners
Crypto has been around for a while, and people are making huge profits. You've landed on the right blog if you want to start your trading journey.
This blog will discuss the technical analysis of a cryptocurrency, the basics of candlesticks, and a brief overview of some popular indicators like Moving Average, RSI, and Oscillators.
You’ll know how you can start your journey as a crypto trader and make some decent profits.
Let's dive straight into the topic:
Japanese Candlesticks
A Japanese candlestick is a technique traders use to simplify price information into a single candle. They are regarded as an exceptionally beneficial tool since traders can easily examine and evaluate a large quantity of data.
How is it represented?
The key elements of Japanese Candlesticks
A candlestick has four major parts:
- Opening price
- Highest price the asset reached
- The lowest price the asset reached
- The closing price of the candle
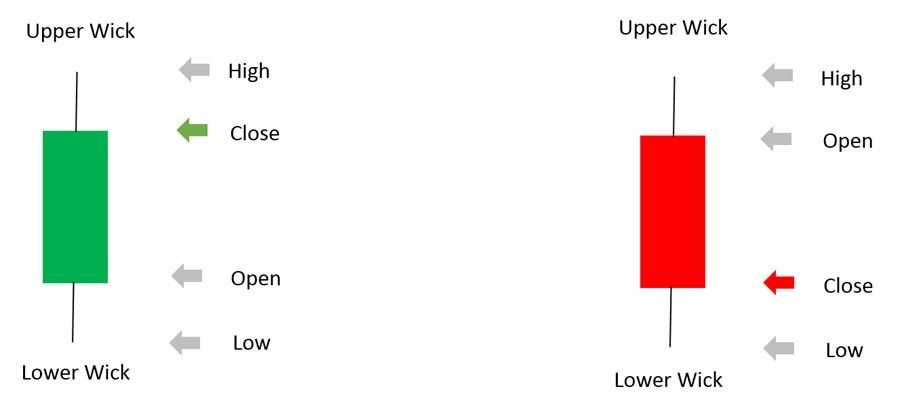
As seen in the image above, the four elements combine to form two portions of the candle:
The wick (which extends up and down) and the body, which contains the opening and closing prices. Depending on the price changes, the wick might be long or short.
As a result, candlestick charts differ from standard bar charts. They present more information while being easy to read.
What do the different colors, sizes, and bodies mean?
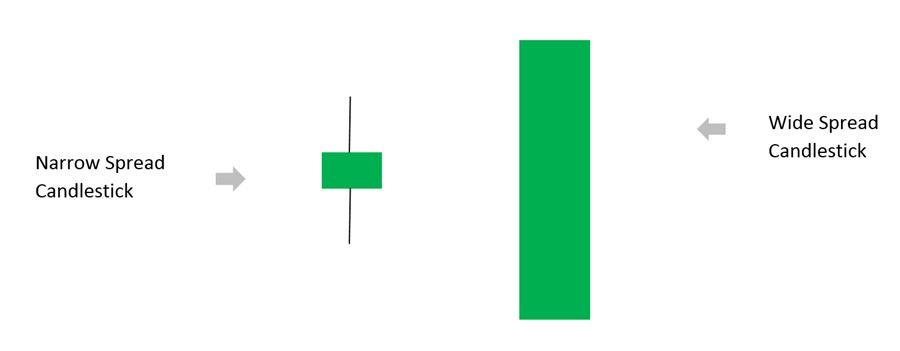
Traders often use the colors green (bullish) or red (bearish) to paint the candlestick, while white (bullish) and black(bearish) are sometimes used.
The bullish candle is made when the close is higher than the open, as seen in the image above, while the bearish candle is formed when the close is lower than the open.
There are a variety of forms available, ranging from those with lengthy wicks on either side to those with absolutely nobody.
The high of the session is shown at the top of the upper wick, and vice versa. The greater the difference between the high and low, the greater the price range of the current session
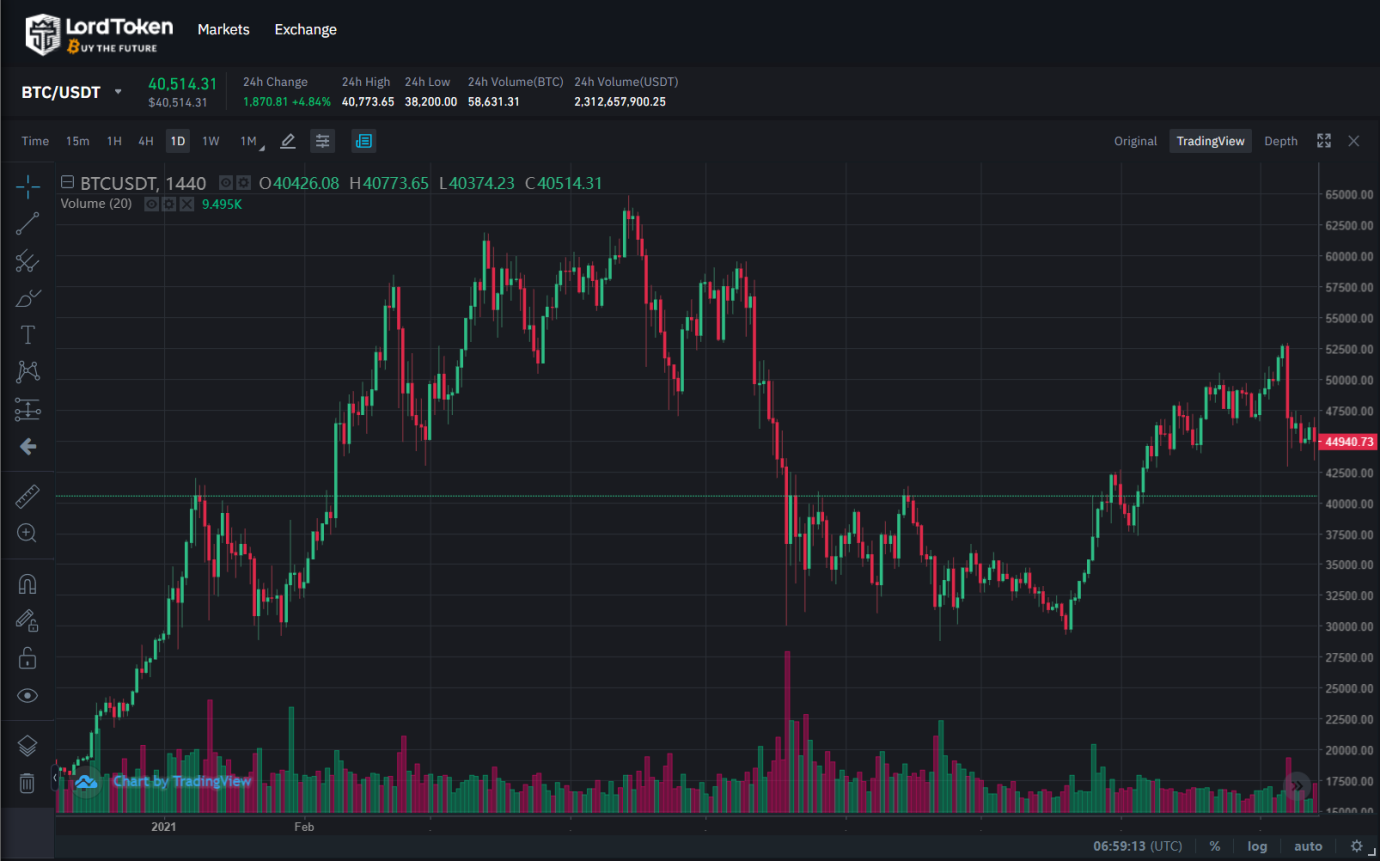
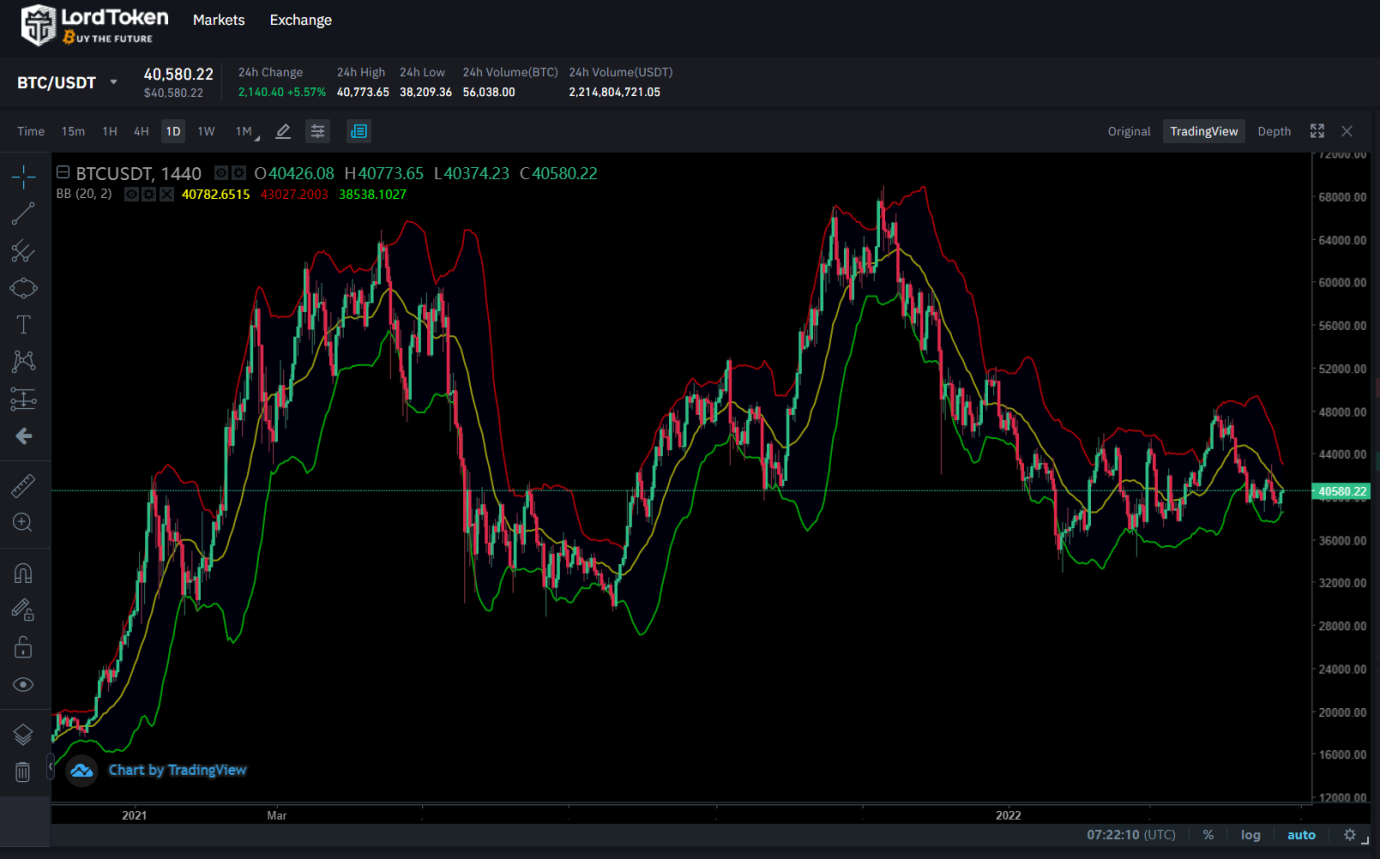
The BTC/USDT daily chart is seen in the image above. A sequence of long green candles can be seen at the right end of the chart.
This candle style is quite powerful because the body is lengthy, and the closure is generally at the top of the candle.
It indicates that the bulls are in command of the market action since they could facilitate a string of wins that resulted in massive gains.
A clear uptrend, defined by a succession of higher highs and higher lows, indicates that buyers are persistently interested in pushing the price higher. On the other hand, long and red candles indicate heavy selling pressure.
Different Types Of Orders
There are 3 types of orders which you can use to place an order:
Market Order
A market order is when an investor places an order to purchase or sell shares but does not specify the price.
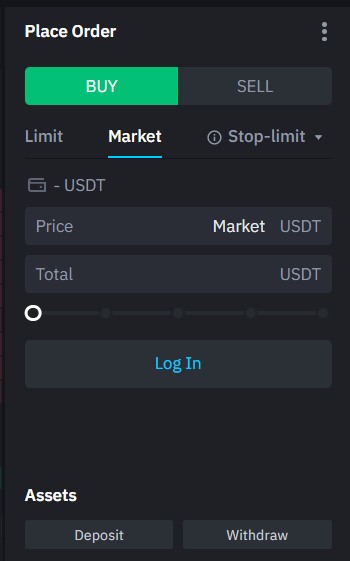
This indicates that the investor is willing to accept the market's best price to acquire or sell crypto. This order differs from a limit order, in which an investor specifies the price at which he wishes to purchase or sell shares.
Limit order
A limit order instructs an exchange to purchase a cryptocurrency at or below a specified price or to sell a cryptocurrency at or above the specified price.
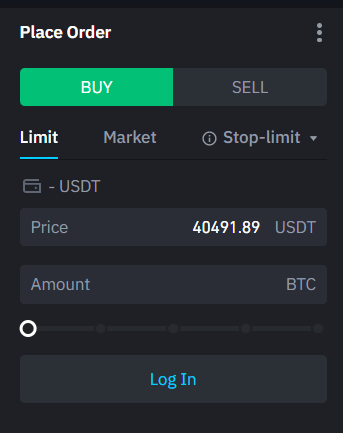
A limit order, in essence, notifies your exchange that you want to purchase or sell an asset, but only if the price of the asset reaches your intended objective. With these instructions, a broker will only execute a deal at a limited price or better if the security achieves that price.
OCO Order
An OCO Order is an abbreviation for "One Cancels the Other Order." This conditional order allows the trader to place two trades simultaneously.
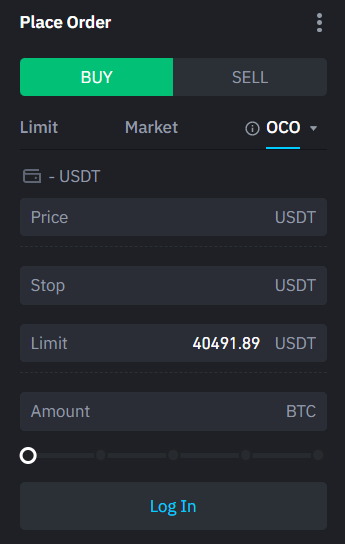
As a result, one or both orders will be completed depending on market conditions. In general, an OCO order is a combination of a limit order and a stop-limit order, the circumstances of which enable only one to be executed.
Resistances and Supports
Resistance refers to the price level over which the price can reach upto. Therefore a resistance level is a price higher than the current price.
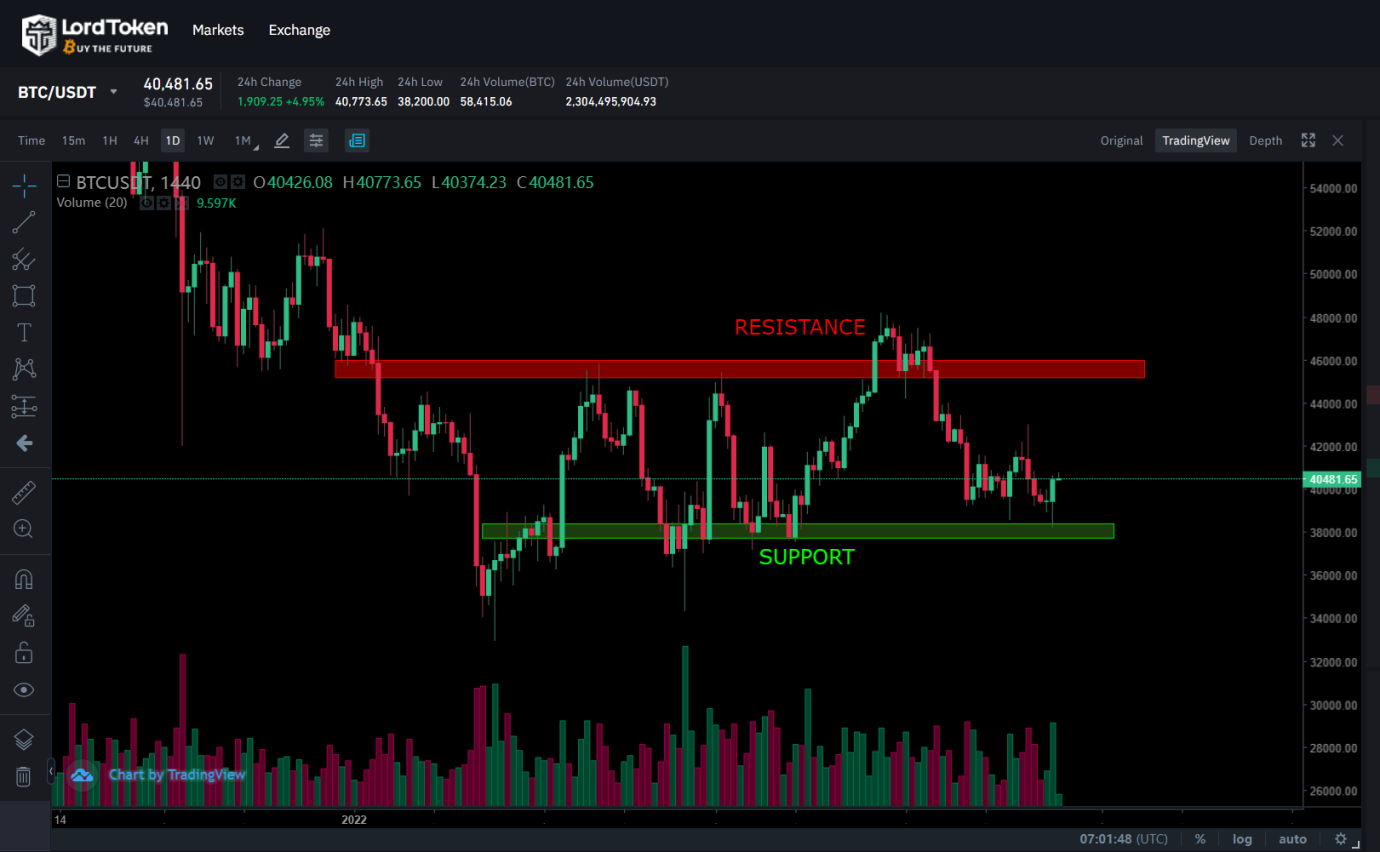
'Support,' on the other hand, is a level below which a crypto price is not expected to fall; hence, a support level is always lower than the current price.
Technical Indicator - RSI
The Relative Strength Index (RSI) is a momentum oscillator commonly employed in sideways or range markets when the price swings between support and resistance.
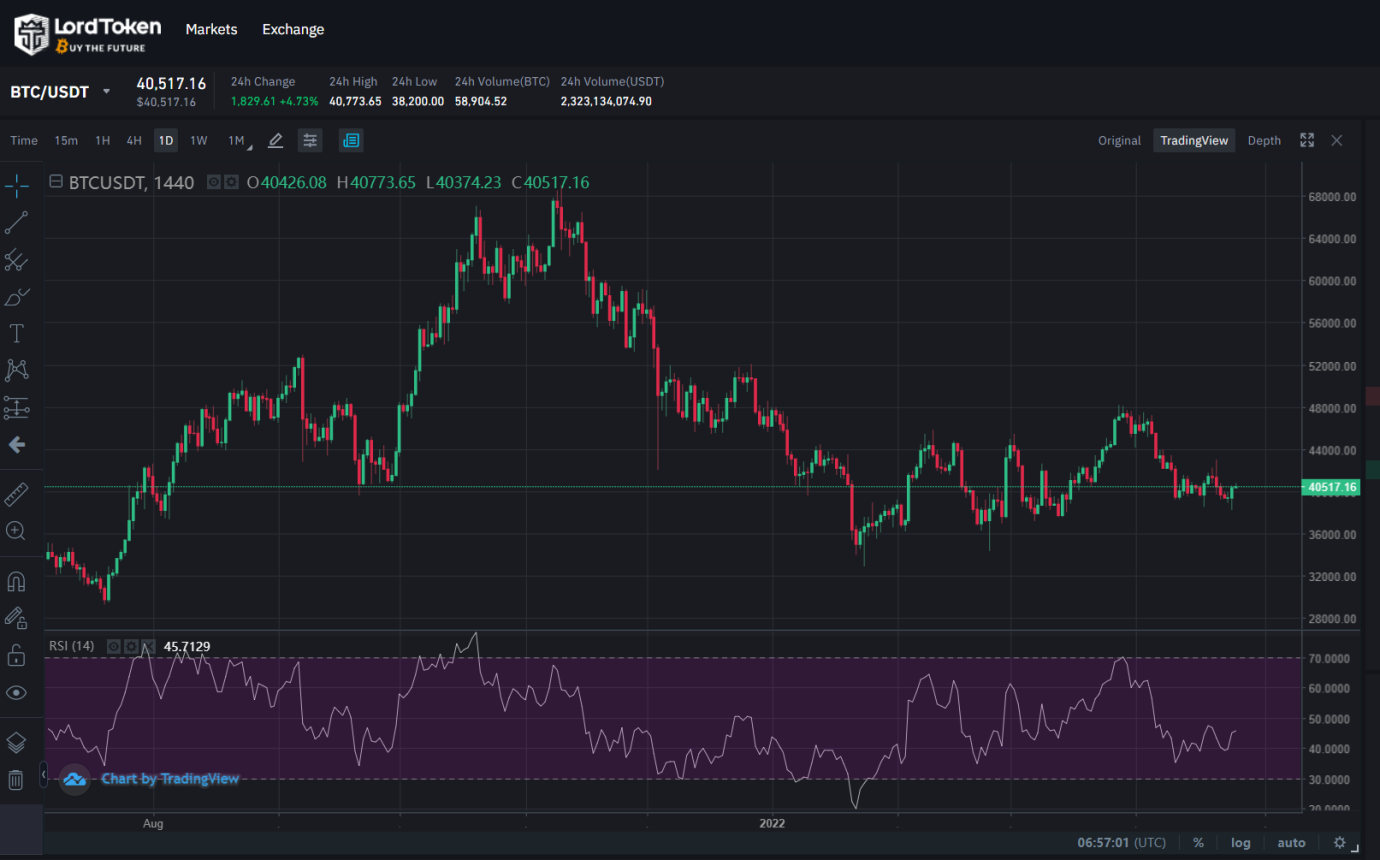
It assesses an asset's overbought and oversold states. The RSI scale runs from 0 to 100.
When the RSI hits 70, an asset is considered overbought, indicating that it may be overpriced. Similarly, if the RSI approaches 30, it suggests that the asset is being oversold and, as a result, is likely to become cheap.
In range-bound, RSI performs admirably. It can help with trend reversals. If the RSI hits 70, the market is said to be overbought, and if it is near 30, the market is said to be oversold.

An RSI failure swing gives a trading indication. A bearish failure swing happens when the RSI climbs above 70, falls below that level, tests the initial peak, fails, and breaks support on the RSI chart. The bullish failure swing is the inverse.
RSI produces patterns such as triangles or head and shoulders tops and bottoms. Breakouts from these patterns on the daily chart frequently occur one or two days before the price breakout, providing the swing trader with necessary forewarning.
All about Moving Averages
Simple Moving Average
As the name indicates, a moving average is a simple line that reflects the closing price and is averaged over time.
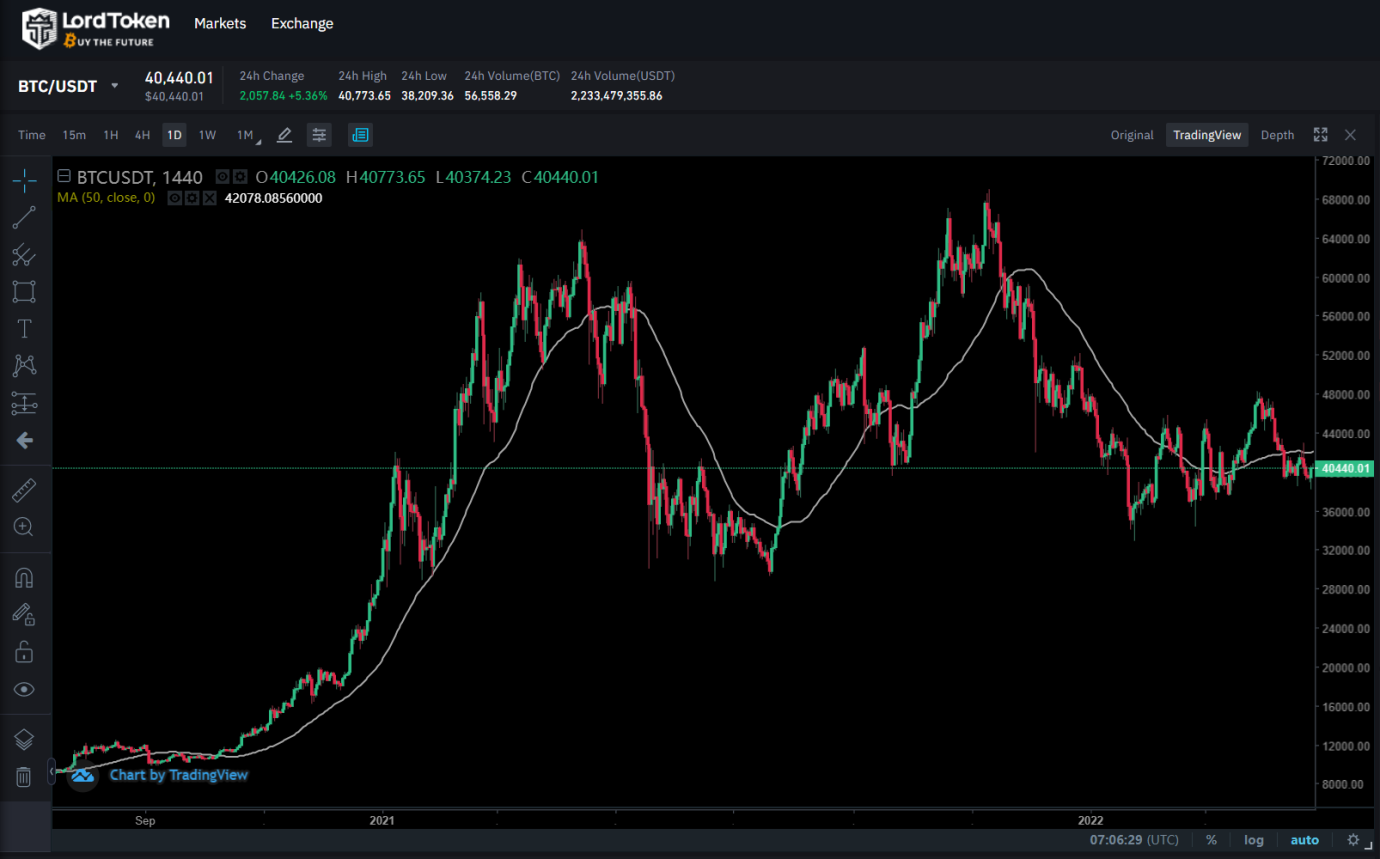
A 50-day moving average shows market confidence in the short run. Because it accurately represents the market for 24 hours, swing traders routinely employ this moving average.
The 200-day moving average
As one might think, the 200-day moving average is an important indicator of long-term trends. This is the "large picture" or "birdseye view" of how a given market performs.
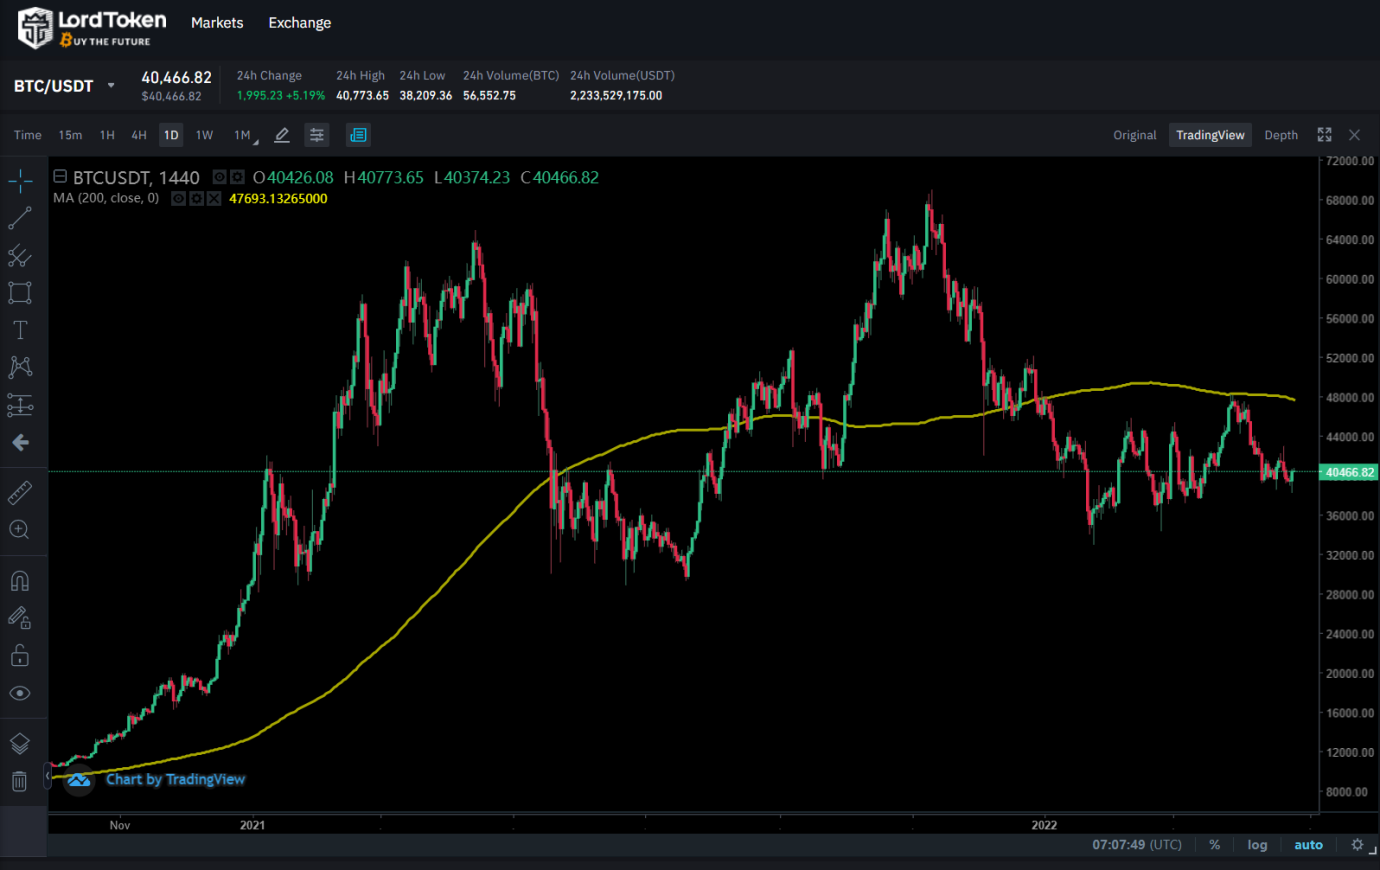
This moving average will not advise you where to put a buy or sell order on a day or swing trading basis, but it will tell you if you should hang onto a cryptocurrency for a while or consider abandoning the market.
The Golden Cross
The Golden Cross occurs when a short-term moving average line crosses the line of a longer-term moving average.
This cross suggests the possibility of a bullish or bearish breakthrough. The cross might be interpreted as a forewarning of what is to come (think red alert).
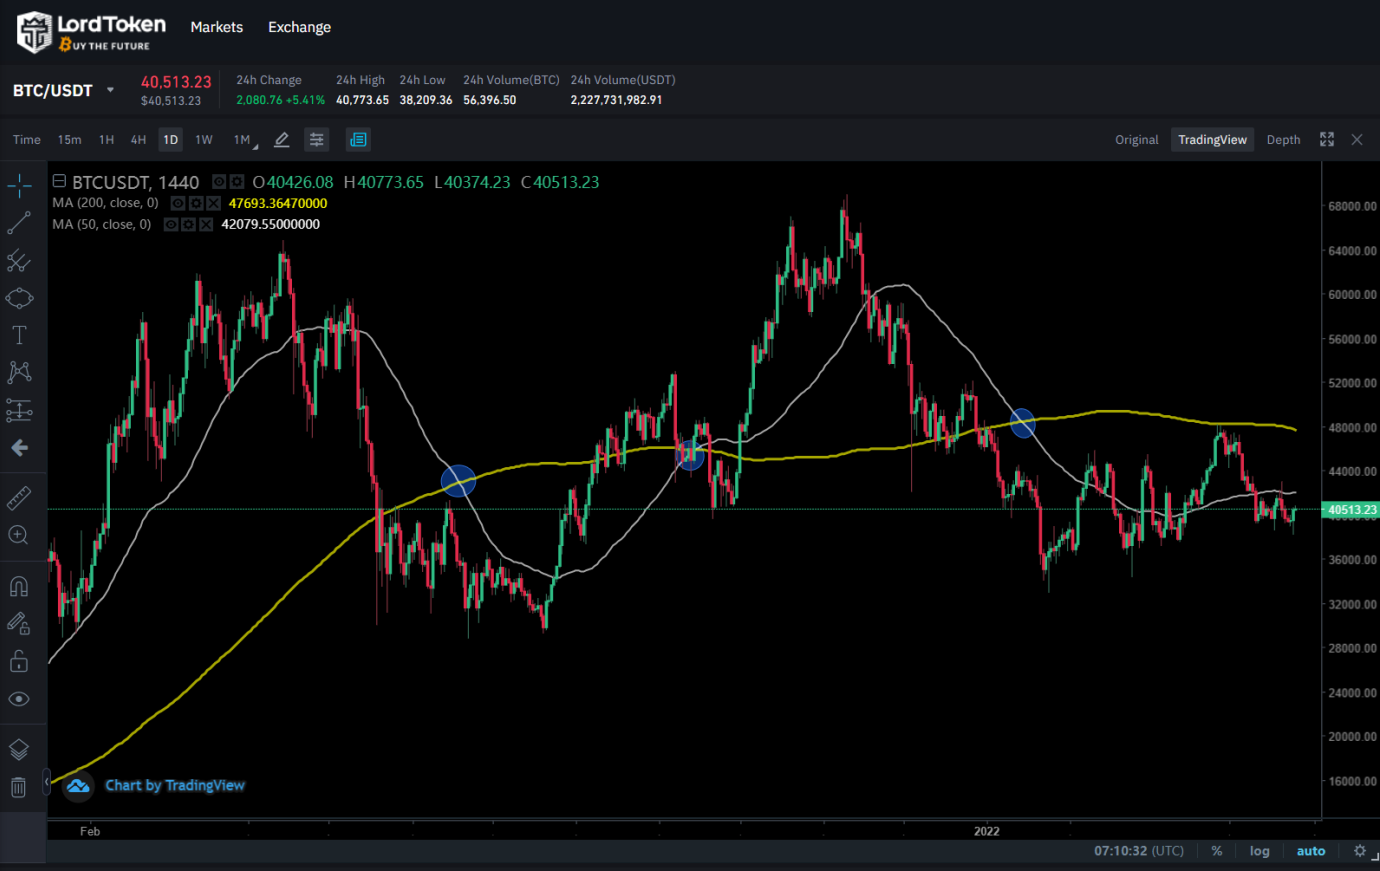
For example, a 50-day moving average crossing over a 200-day moving average implies imminent negative sentiment. The same may be said for bullish emotions.
Bullish sentiment will soon take over if the 50-day moving average crosses under a 200-day moving average.
Fibonacci Retracement
Fibonacci Retracement is a technical analysis technique used to determine support and resistance levels. It gets its name from its usage of the Fibonacci sequence series.
It is likewise predicated on the assumption that markets would retrace a predictable percentage of a move before moving in the original direction.
Fibonacci Retracements are ratios that are used to indicate possible reversal levels. The most common Fibonacci Retracements are 61.8 percent and 38.2 percent.
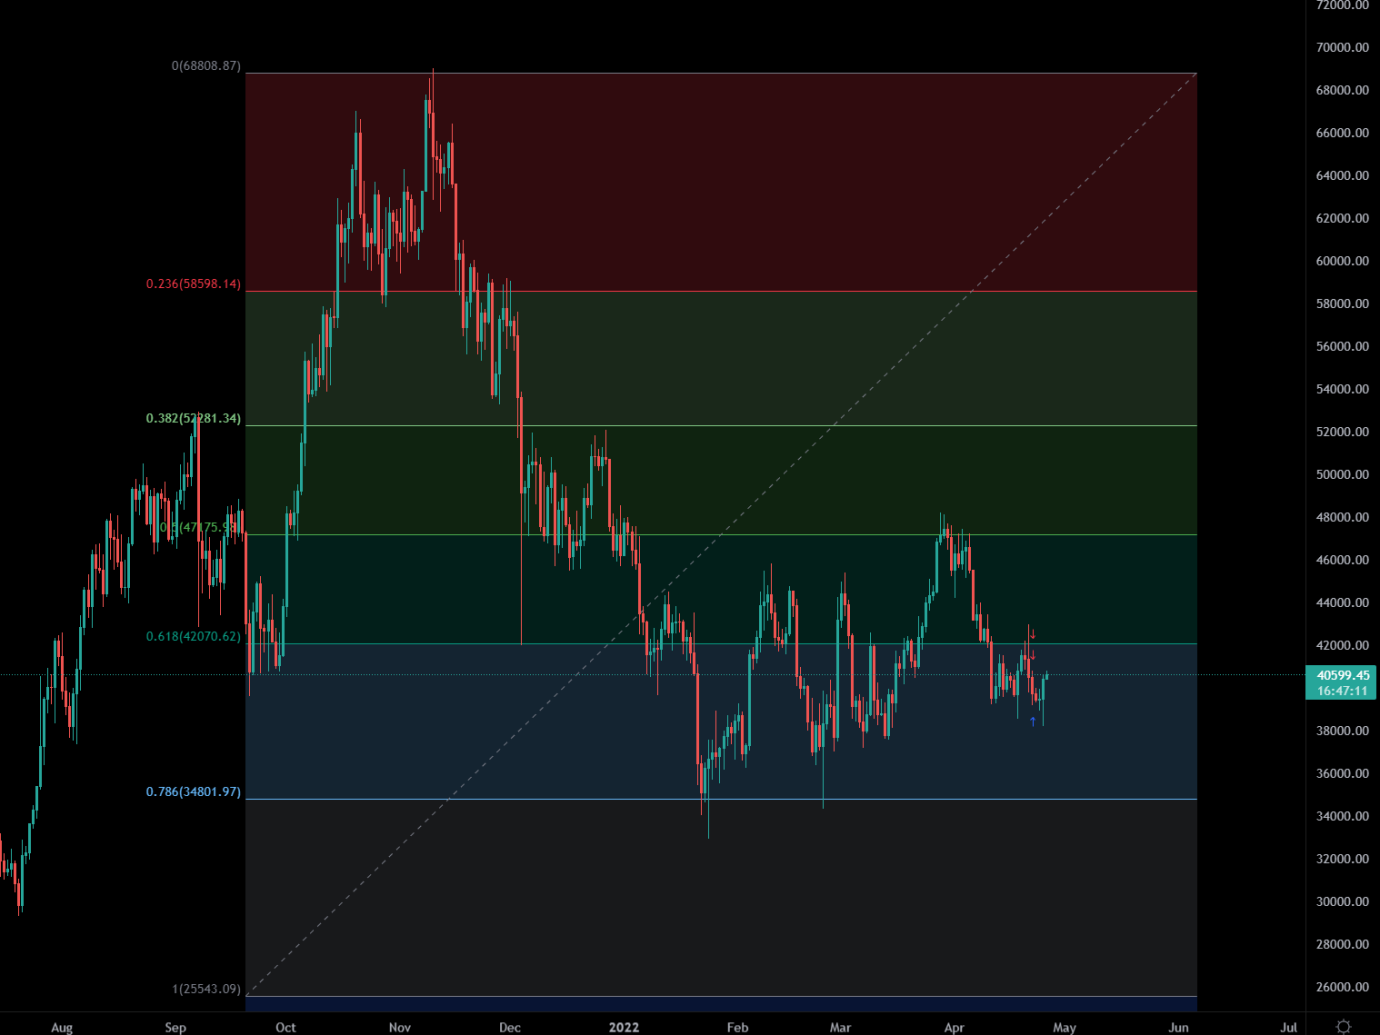
In an uptrend, purchase when the price falls back and stalls at one of the Fibonacci retracement levels before resuming its upward movement.
Set a stop-loss immediately below the recent price bottom or below the lower Fibonacci retracement line to allow yourself some extra room. Ideally, the retracement level at which you buy should be one at which the asset has the potential to revert.
Bollinger bands
The Bollinger bands indicator is an oscillating indicator that is used to assess market volatility.
Bollinger bands are a type of oscillator indicator that is used to calculate price volatility.
They assist you in determining if a price is high or low compared to its recent moving average and forecast when it will fall or climb back to that level.
- When the price crosses the upper band, it is overbought and tends to return to the moving average band.
- When the price approaches the lower band, it is deemed oversold and tends to return to the moving average band.
- The Bollinger bands become smoother by extending the time employed, and the price breaks the bands less frequently.
- Decreasing the periods makes the bands more choppy, and the price frequently breaks them.
Conclusion
Technical analysis, when done correctly, may massively boost your profitability as a trader.
Keep in mind that no technical indication is flawless. None of them consistently provides signs that are 100 percent correct.
That's it for this quick guide; we hope that by now, you know how to use technical analysis for your benefit.
Join LordToken and use our platform to promote projects that will impact our everyday life.
